STRATOTANK
MetaTrader 5 · Strategy Tester
Skyhawk · Portfolio
23PAIRS
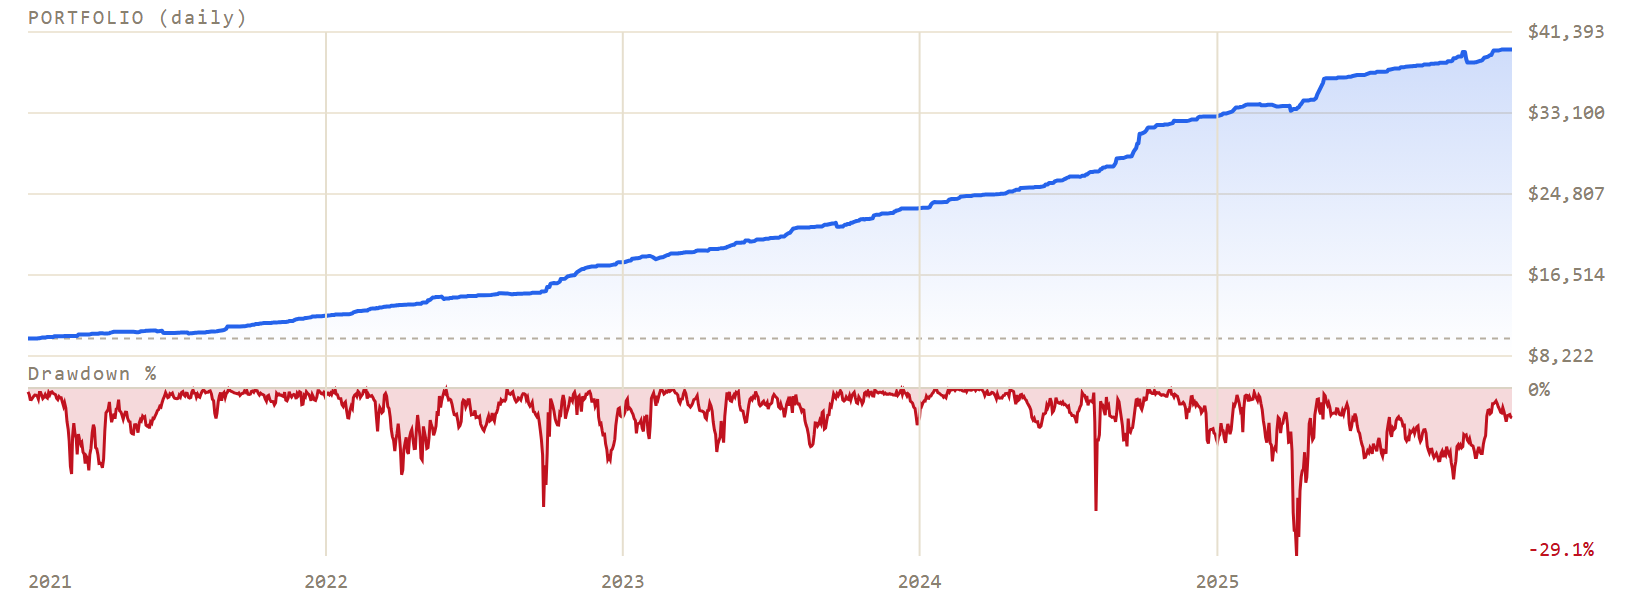
+$29,758.18
Net profit
+297.58%
Return on capital
3.52
Profit factor
77.15%
Win rate
29.13%
Max drawdown (equity)
Summary
Gross profit$41,572.24
Gross loss-$11,814.06
Expected payoff$15.78
Recovery factor3.05
Realized drawdown3.13%
Total trades1886
Profit trades1455 (77.15%)
Loss trades431 (22.85%)
Largest win / loss$216.04 / -$232.30
Avg win / loss$28.57 / -$27.41
Longs vs shorts
Long982 trades
78% won
Short904 trades
76.22% won
Per-pair breakdown
| Pair | Net contribution | PF | Win% | Trades |
|---|---|---|---|---|
| AUDJPY | +$2,362 | 4.36 | 75.5 | 106 |
| GBPUSD | +$2,327 | 4.8 | 73.8 | 122 |
| GBPCHF | +$2,050 | 7.62 | 83.9 | 62 |
| GBPNZD | +$1,910 | 3.13 | 77.2 | 79 |
| GBPAUD | +$1,850 | 3.65 | 78.9 | 95 |
| NZDJPY | +$1,739 | 4.61 | 81.2 | 85 |
| EURCHF | +$1,616 | 11.7 | 80 | 80 |
| GBPCAD | +$1,500 | 3.49 | 77.1 | 105 |
| NZDUSD | +$1,254 | 3.57 | 76.7 | 90 |
| AUDCHF | +$1,225 | 6.41 | 81.5 | 54 |
| AUDUSD | +$1,216 | 11.03 | 87.7 | 57 |
| EURGBP | +$1,151 | 3.68 | 77.4 | 84 |
| AUDCAD | +$1,135 | 9.23 | 85.7 | 77 |
| NZDCHF | +$1,124 | 6.86 | 80.3 | 61 |
| NZDCAD | +$1,062 | 7.5 | 81 | 79 |
| EURAUD | +$1,059 | 4.3 | 74.5 | 47 |
| EURCAD | +$877 | 2.15 | 69.4 | 98 |
| EURNZD | +$856 | 15.79 | 86.1 | 36 |
| EURUSD | +$806 | 1.64 | 69.2 | 117 |
| AUDNZD | +$736 | 7.76 | 79.2 | 72 |
| USDCAD | +$728 | 1.85 | 77.8 | 90 |
| USDCHF | +$680 | 1.5 | 68.8 | 93 |
| CADCHF | +$494 | 1.57 | 72.2 | 97 |
← Back to Skyhawk on Stratotank
Based on a MetaTrader 5 Strategy Tester run of Skyhawk trading all 23 pairs from a single $10,000 account (settings as shipped). Per-pair figures are each pair's net contribution to that one shared account. Figures reflect closed trades; positions open at period end are excluded.
Past performance does not guarantee future results. Trading carries risk of loss.
Based on a MetaTrader 5 Strategy Tester run of Skyhawk trading all 23 pairs from a single $10,000 account (settings as shipped). Per-pair figures are each pair's net contribution to that one shared account. Figures reflect closed trades; positions open at period end are excluded.
Past performance does not guarantee future results. Trading carries risk of loss.