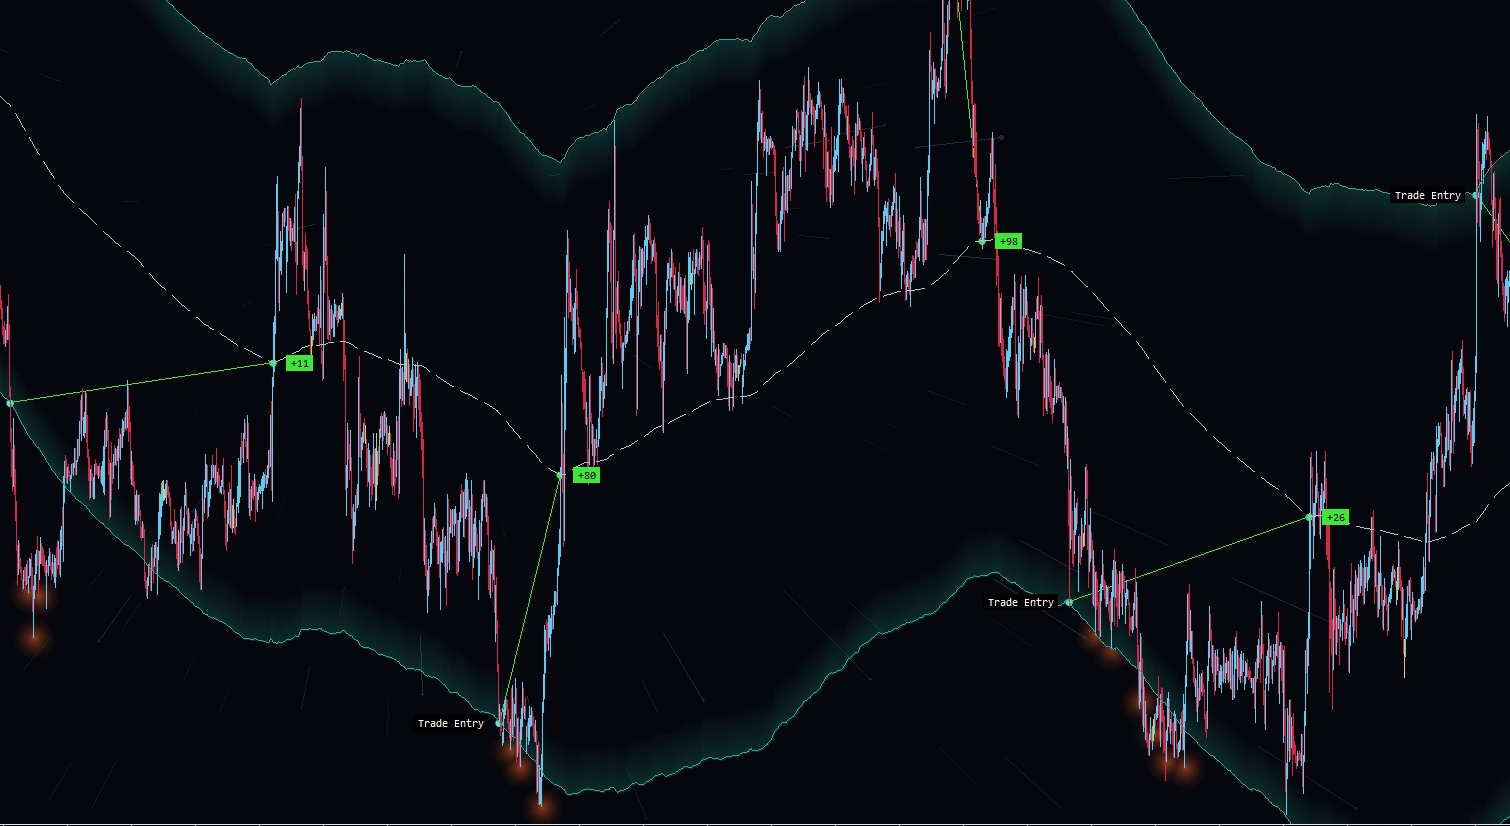
This is how we trade the Meridian Channel.
Watch the walkthrough.
Follow the setup, reports and optimization in MetaTrader 5.
Price moves. So does its average.
Watch a chart for a while and you will see price rise, fall and pull back. Even when the market is trending, the journey has swings along the way.
A moving average smooths those movements into a line. It gives us a reference for where price has been trading. As new prices arrive, that average changes too.
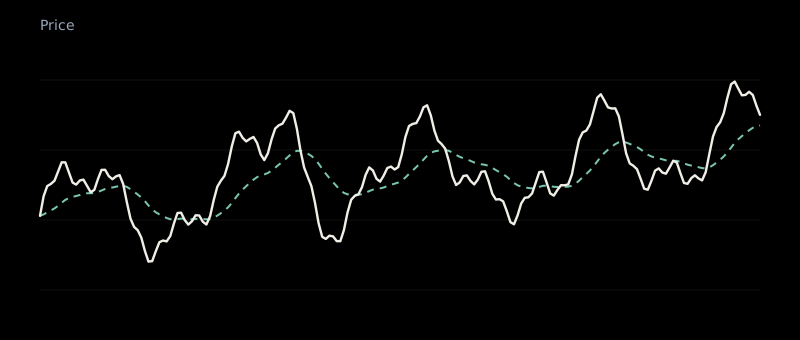
Sometimes price stretches well above the average; sometimes it falls below it. A move back towards that average is what we mean by mean reversion. This movement away and back is the behavior we want to understand.
The average is moving, rather than a fixed destination. Price can stay on one side for a long time, and a return is never guaranteed. We need to study both the stretch and what happens after it.
Find the envelope that holds 95%.
Once we can see the average, the next question is: how far does price usually move away from it? A small swing on one market might be a large move on another. We need to measure the symbol and timeframe we want to trade.
Our aim is to find an envelope around the moving average that contains price about 95% of the time in the history we study. The upper and lower edges separate the usual movement from the less common stretches beyond them.
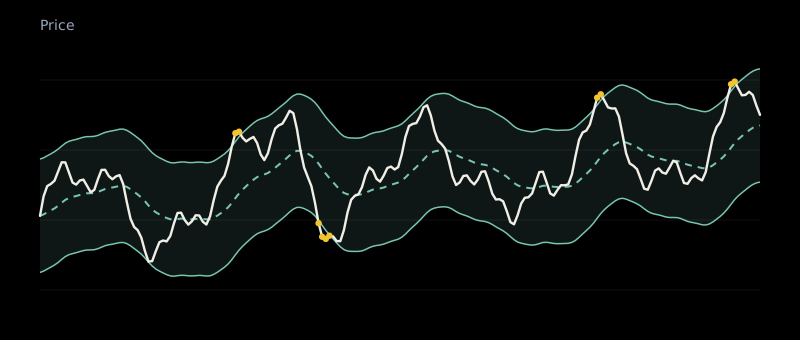
Think of 100 historical bars: we are looking for a width that contains roughly 95 of them, with about five extending outside one edge or the other. That is about 5% outside across both sides together.
In Meridian Channel, the distance is measured in ATR, a measure of volatility. The Details pane's 95% OF THE TIME figure summarizes each bar's furthest stretch from the mean in ATR units. It gives us a reference for choosing the band's deviation setting.
This describes the history we measured. It is not a 95% chance of winning a trade or a promise that future prices will stay inside. The envelope helps us identify an unusual stretch; we still need to examine how those stretches behave.
Trade the stretch back towards the mean.
With the envelope in place, we have two reference points: the outer band for the entry and the moving average for the target. We look for price to stretch to an edge, then trade in the direction of a return towards the mean.
At the lower band, look to buy.
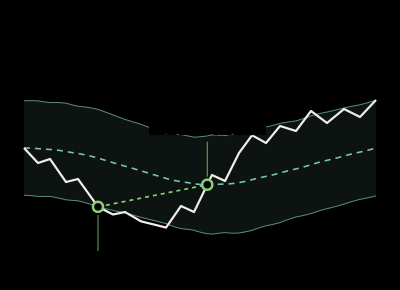
Price is below its average. The trade looks for a move up towards the mean, where we close with Mean selected as the target.
At the upper band, look to sell.
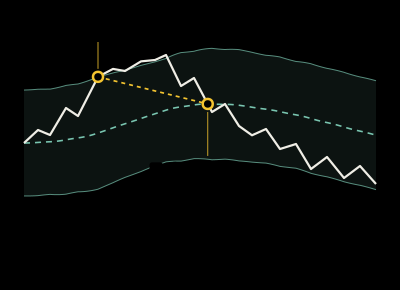
Price is above its average. The trade looks for a move down towards the mean, where we close with the same target rule.
These examples use a Touch entry: the model enters when price reaches the band. If you choose Bar Close, it waits for a candle to close outside the band. Use the entry rule you tested.
Notice that price moves further against each entry before returning. These are simplified examples of the idea, not a prediction of the next trade. The mean also moves, so a return can still close a basket at a loss. Set your lot size and exit rules before entering; the band itself does not limit your loss.
Set up your first chart.
- Install the indicator. Use MetaTrader 5's Market tab for an MQL5 purchase, or Hangar for Stratotank Plus. See buying options.
- Open your chart. Choose a symbol and timeframe in MT5. The example here is EURGBP on H1.
- Add Meridian Channel. In MT5's Navigator, expand Indicators and find Meridian Channel (shown as ST_MeridianChannel in this recording). Drag it onto the chart and confirm with OK.
See your charts as one portfolio.
Once you are studying more than one symbol, Meridian Portfolio brings your open Meridian Channel charts together. It uses their settings to model historical performance across the combined portfolio.
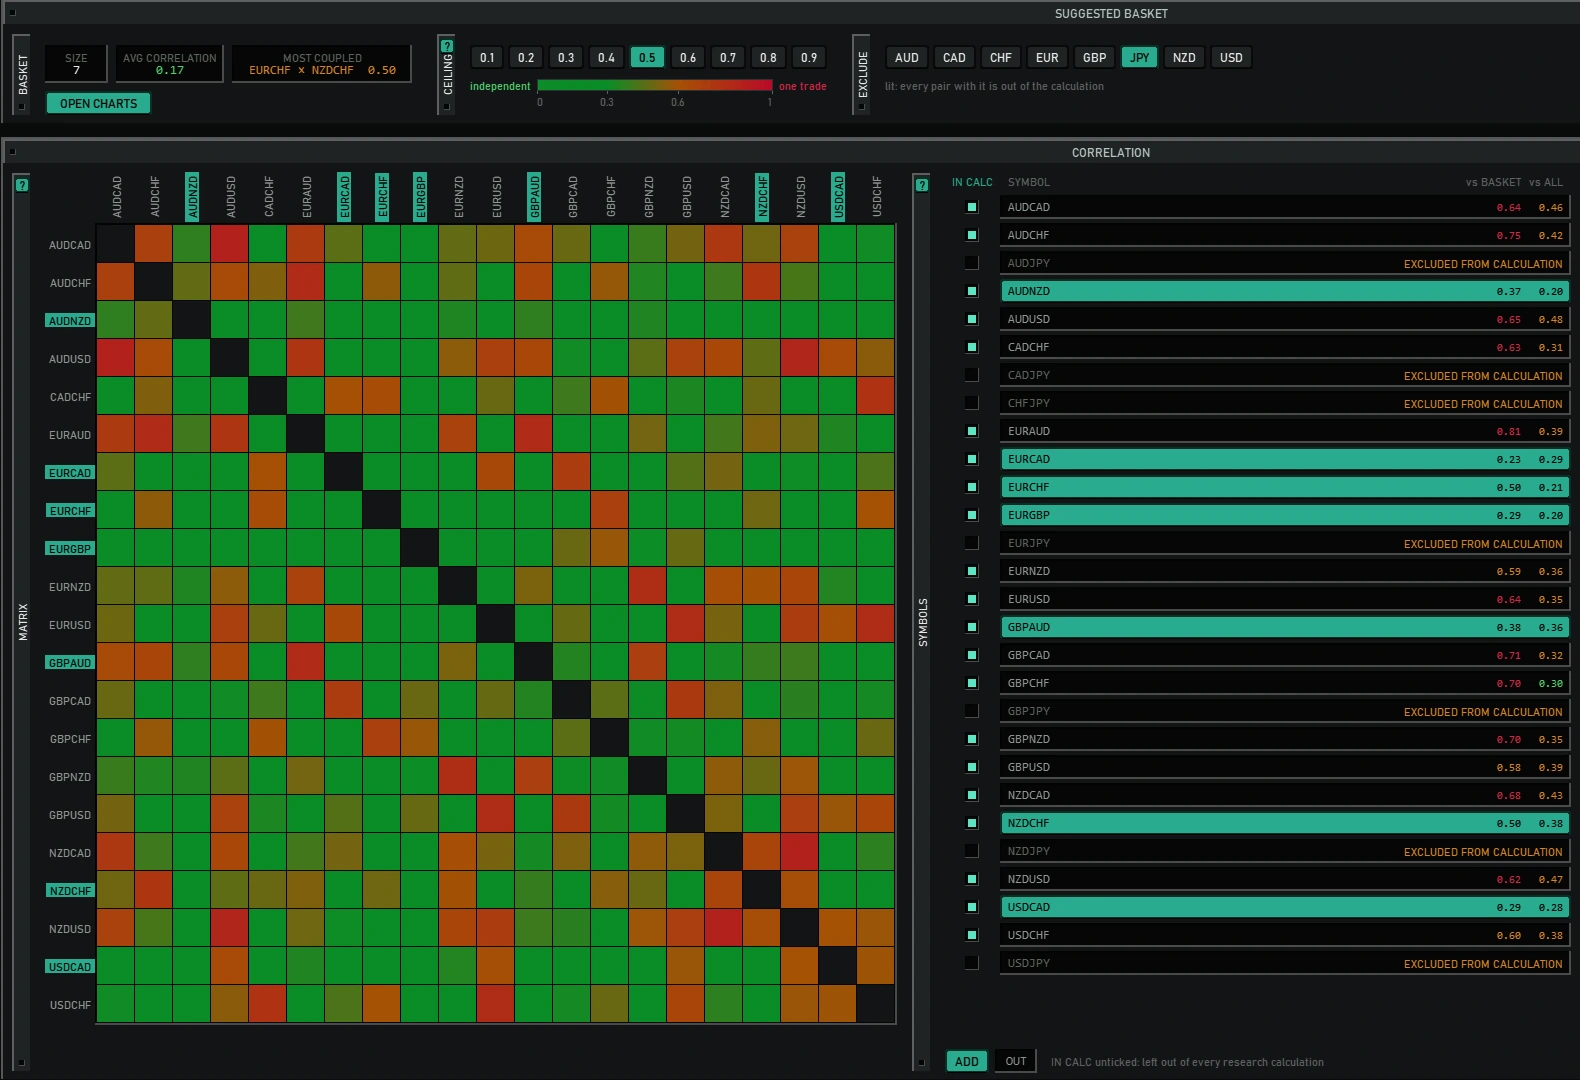
- Compare symbols. Use return correlation to see how closely their movements are linked.
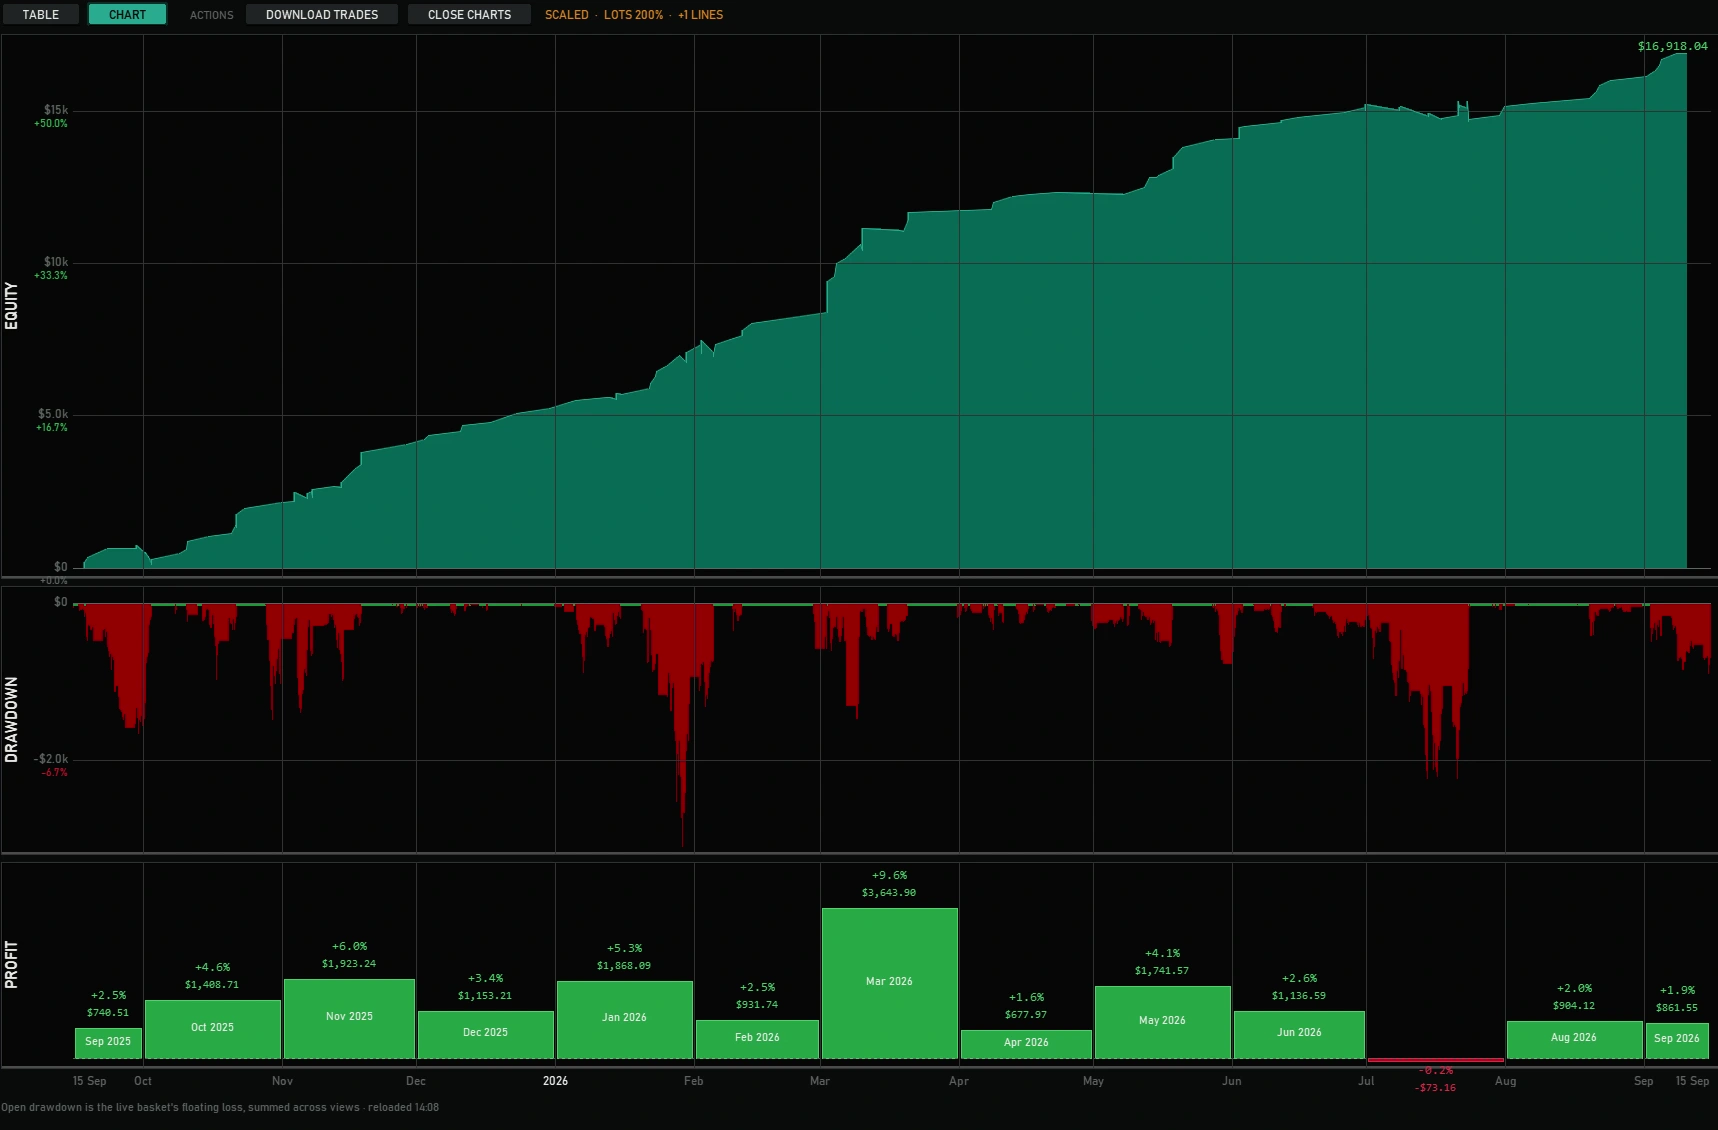
- Review combined performance. Inspect portfolio equity, floating drawdown and monthly results.
- Calculate portfolio risk. Explore how lot sizing and risk limits change the historical results.
Meridian Channel helps you study each chart; Meridian Portfolio helps you understand how those charts work together. These are analysis tools: the simulations do not place live orders.